The scwplot package provides functions for applying consistent SCW-branded aesthetics to ggplot visualisations in R, as well as additional functionality that produces clean plots and makes plotting in R easier.
Installation
scwplot is not available on CRAN. In order to install the package, you must do so directly from this GitHub repository with {devtools}, using the code below:
# install.packages("pak")
pak::pak("NHS-South-Central-and-West/scwplot")
If you haven’t already installed devtools, you will also have to run the first line of code in the code chunk.
Usage
The primary purpose of scwplot is to extend the functionality of ggplot to create consistent SCW-style figures, so usage builds on top of basic ggplot2 functionality.
A simple example of the scwplot usage:
library(ggplot2)
library(scwplot)

ggplot(mpg, aes(displ, hwy, fill = as.factor(cyl))) +
  geom_jitter(
    shape = 21, size = 6, stroke = 1,
    alpha = .8, width = .5, height = 2.5
    ) +
  labs(title = "Example {scwplot} Usage with MPG Dataset",
       subtitle = glue::glue("Plotting the Effect of Engine Displacement on ",
                             "Highway Miles Per Gallon, Split by Cylinders"),
       caption = "Source: EPA (https://fueleconomy.gov)",
       x = "Engine Displacement (in Litres)", y = "Miles per Gallon") +
  scale_fill_qualitative(palette = "scw") +
  theme_scw()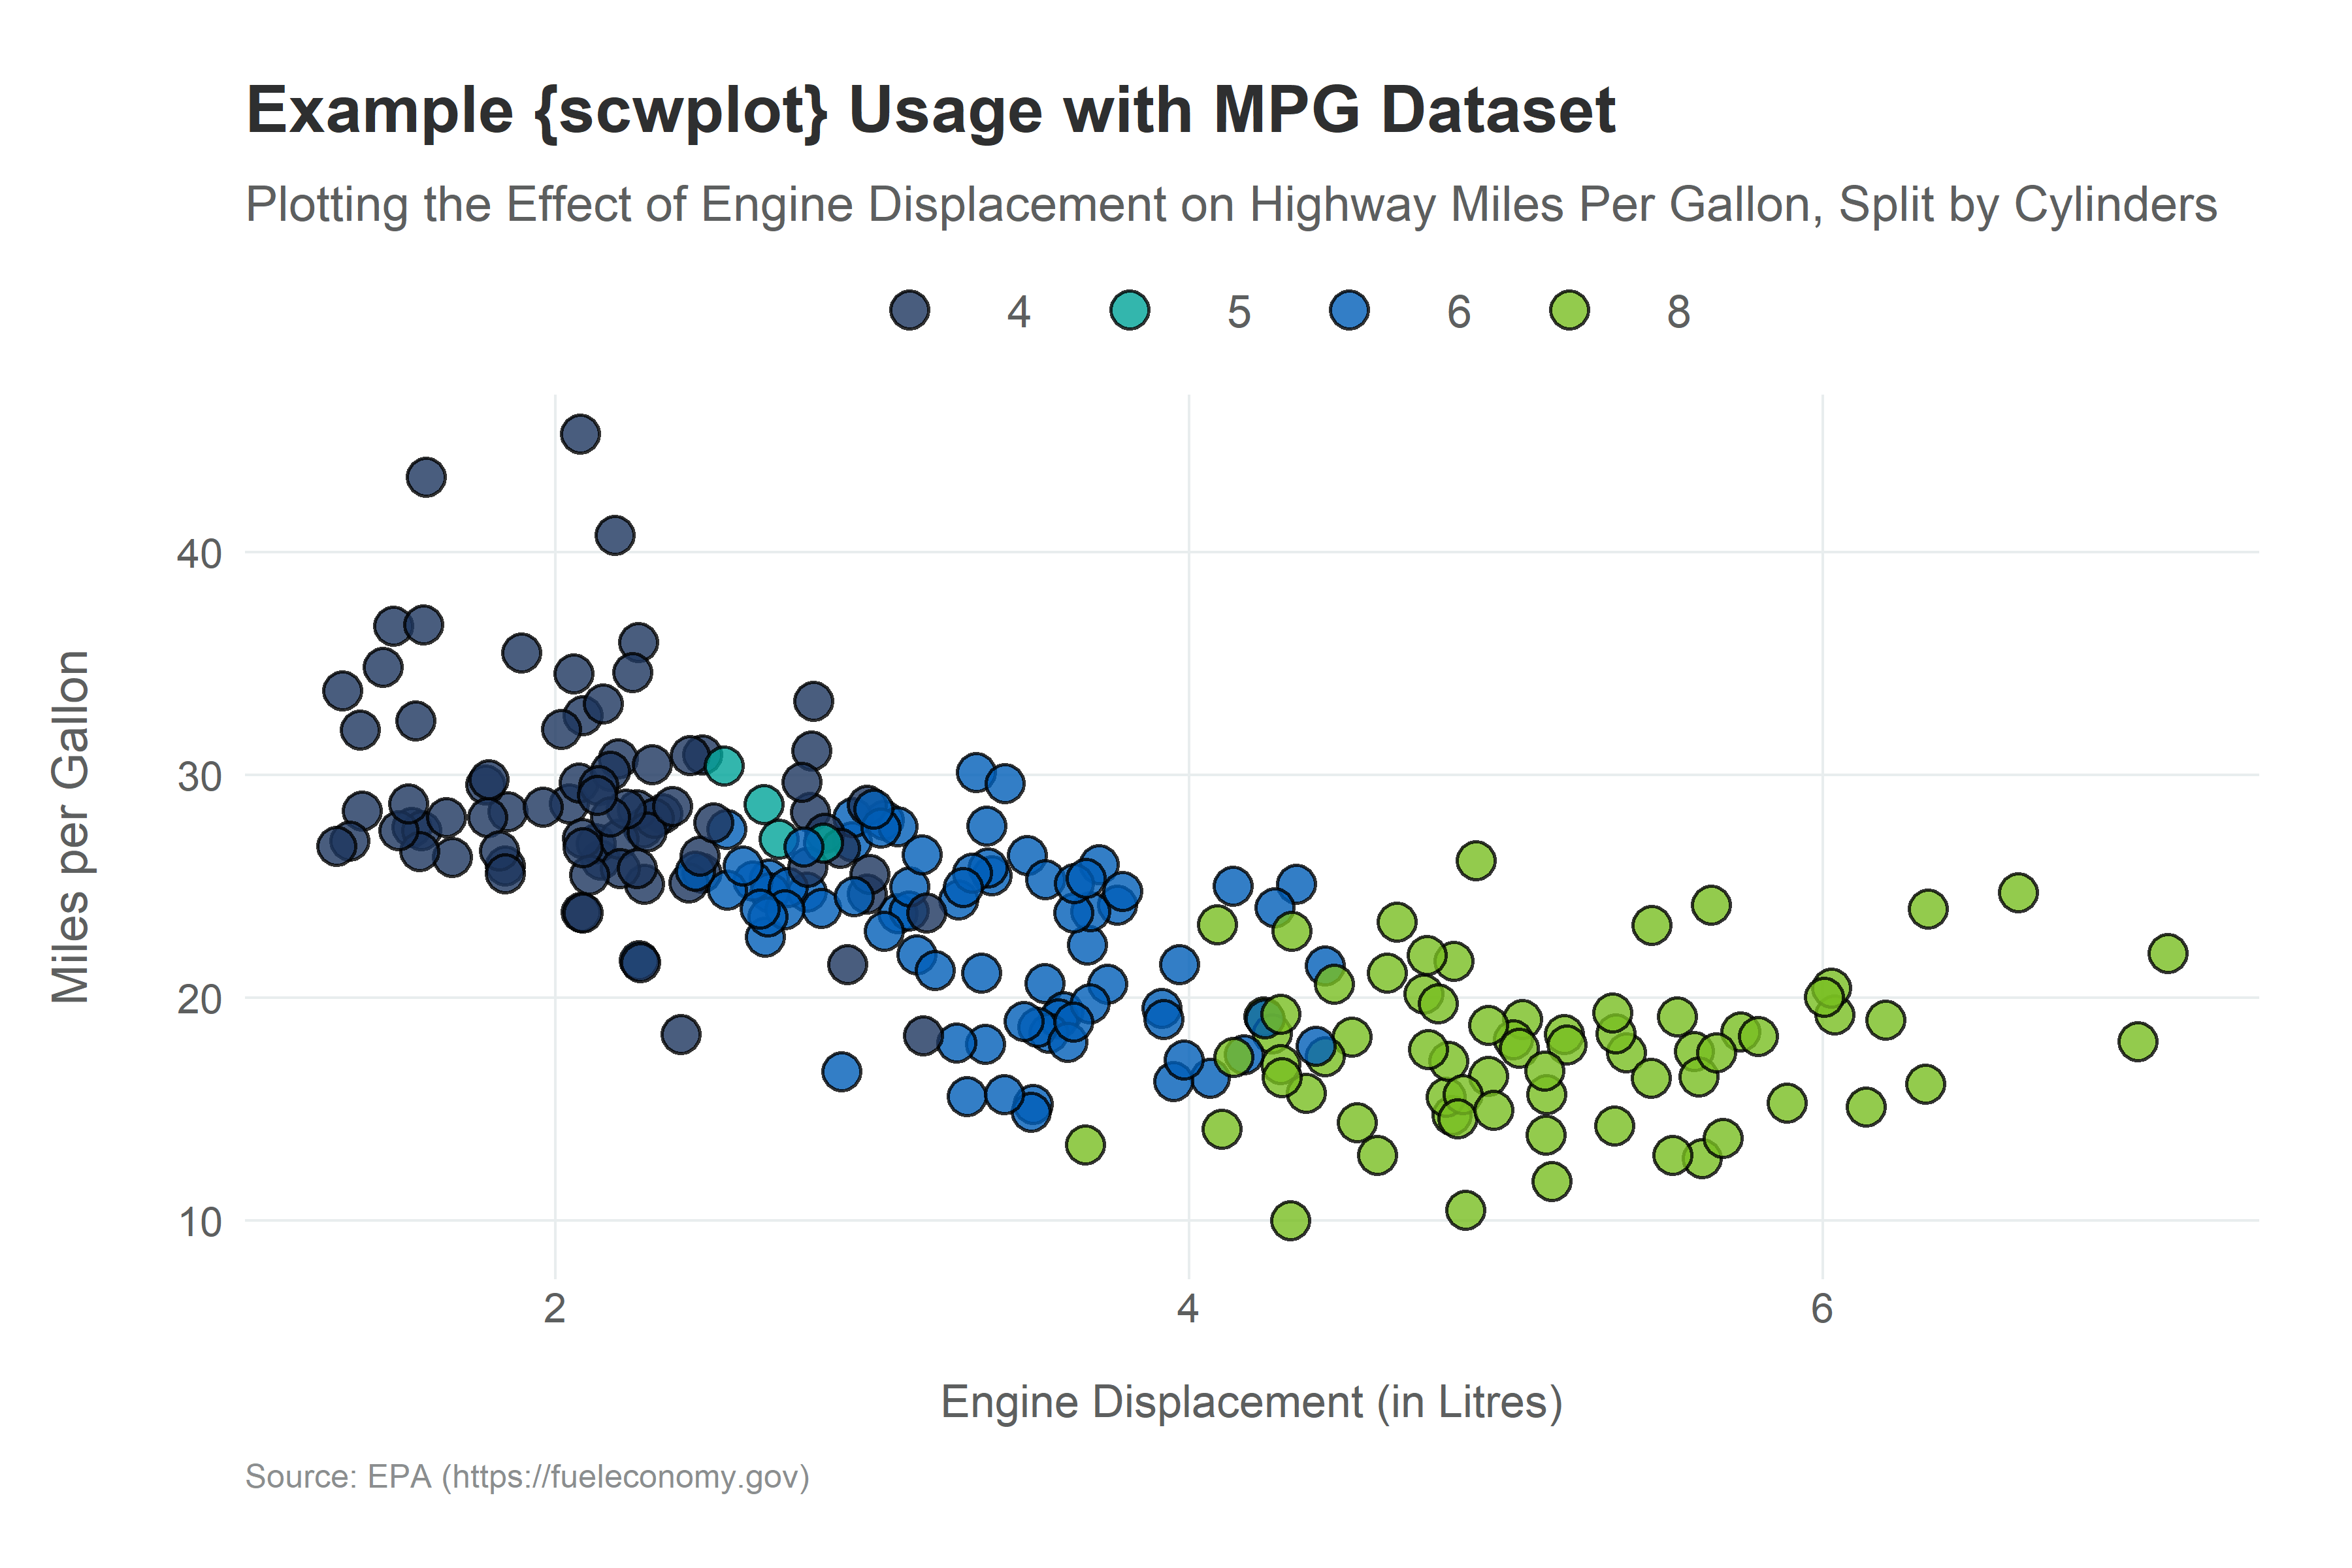
The package includes the following functionality:
- Themes - functions for controlling the display of plot theme elements.
- Colour - functions for incorporating the use of colour to display data.
- Images - functions for adding images (i.e., brand images and logos) to plots.
- Format - functions for applying final formatting to a plot and saving it to file.